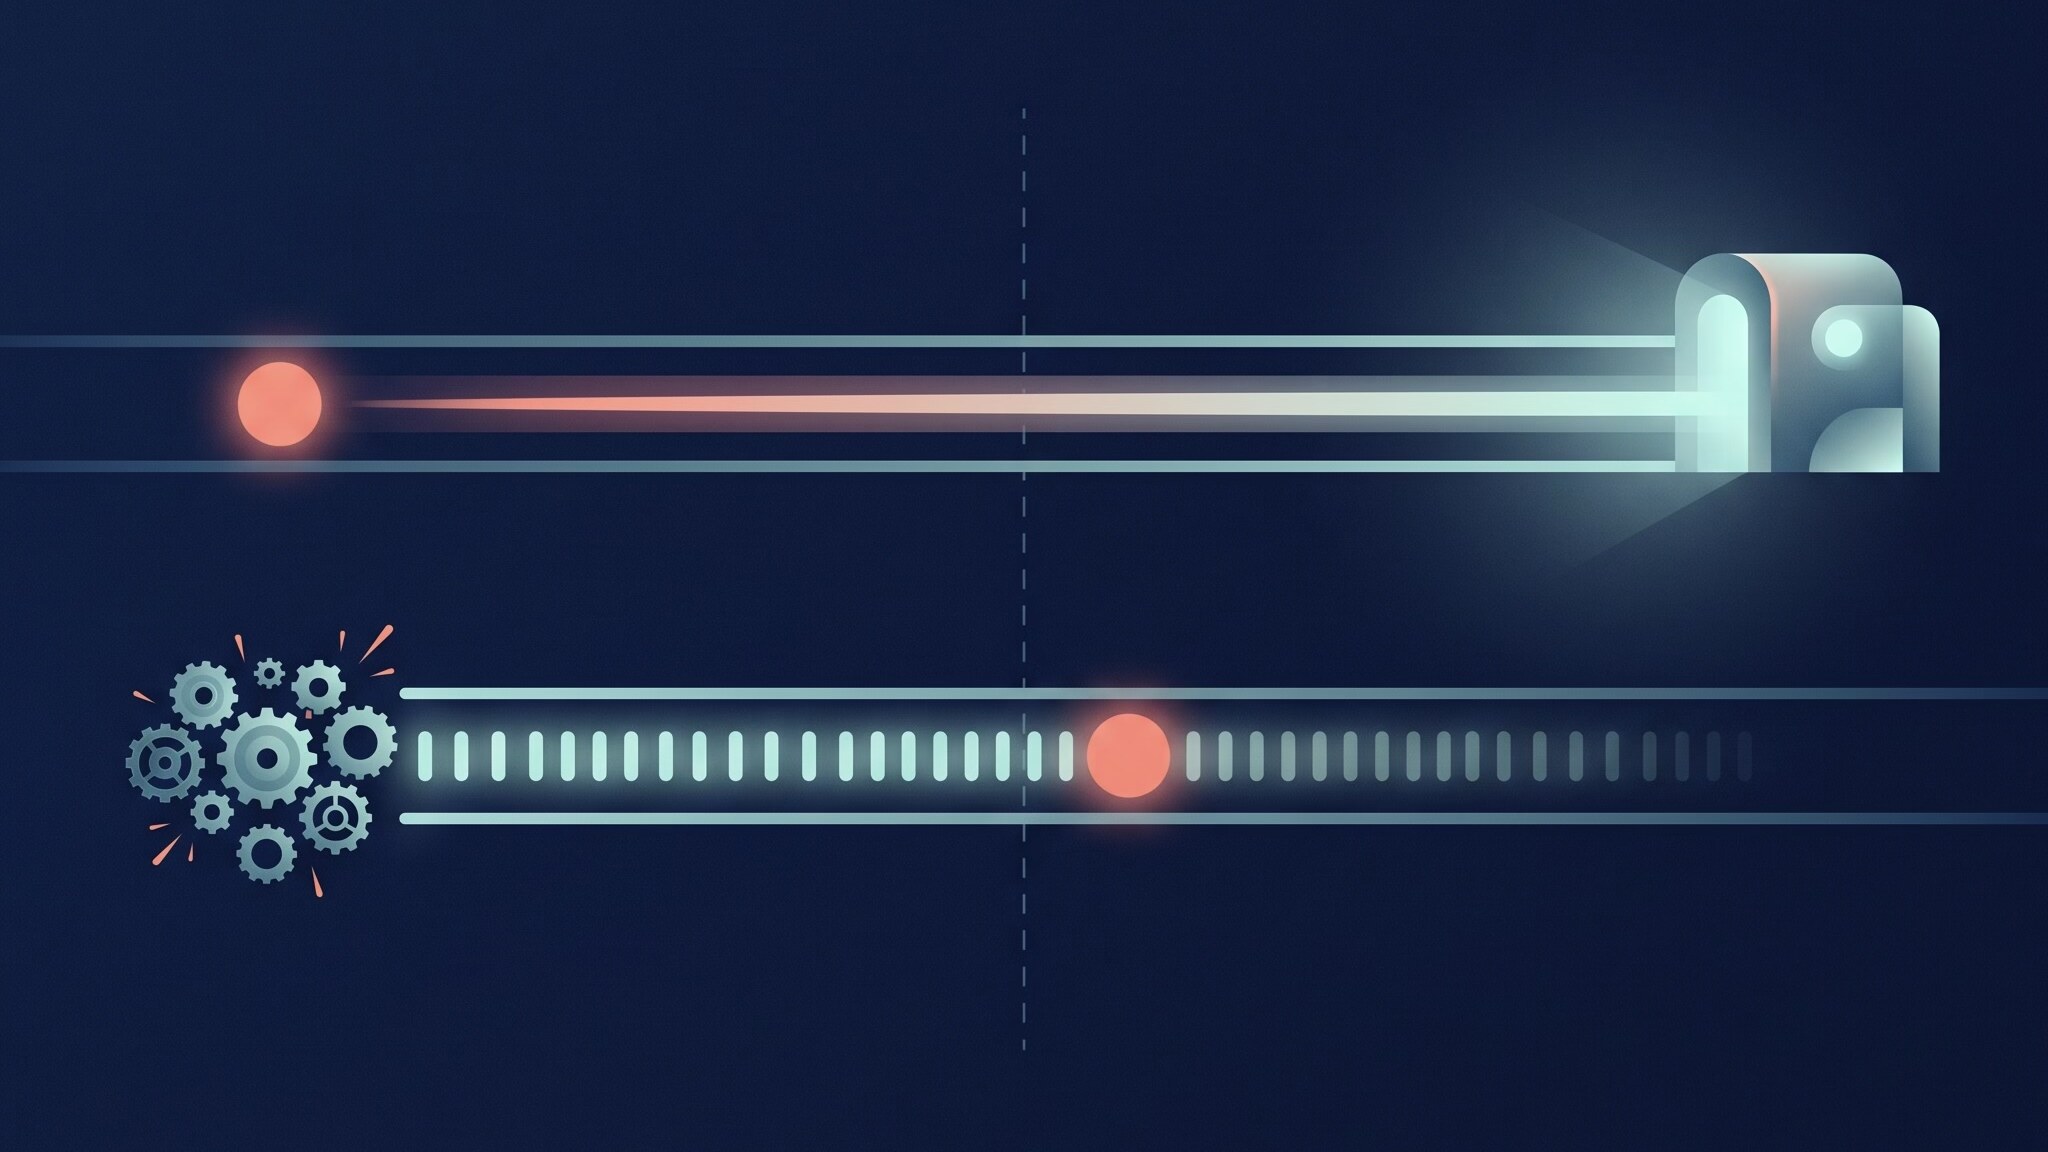
Take one dot. Move it across a view in half a second. Do it with UIView.animate, then do it with withAnimation. On screen the two look the same. Underneath they are not the same thing, and the difference changes depending on whether you are on a Mac or on an iPhone.
I thought I knew the answer. I did not, and the first answer I was given turned out to be true on one platform and false on the other. So I stopped reading and started measuring. This post is the measurements: charts drawn from the recorded data, byte dumps of what was really in memory, and recordings of the real screens.
The answers I started with
Core Animation is data. You describe a motion once: a key path, a from value, a to value, a duration, a curve. That description goes to the render server, a separate process, and the render server runs it frame after frame. Your app does nothing more until the animation ends.
Then someone showed me a call stack from a Mac that said SwiftUI is the opposite. On each pass the system asks the app for the state at this time, the app works it out on the main thread and writes the layer. A pull model. The render server only sees the results.
And Apple says something else again. In WWDC 2023, session 10156, “Explore SwiftUI animation”, the sentence is that for built-in animatable attributes like scaleEffect, SwiftUI does the work off the main thread and without calling into your view code.
Those three cannot describe one mechanism. This is what I ended up with, drawn first so you can hold it against the evidence in the rest of the post:
flowchart LR
  subgraph A["UIKit and AppKit"]
    direction TB
    a1["you animate<br/>a view"] --> a2["one animation<br/>object is added<br/>to the layer"] --> a3["one commit to<br/>the render server"] --> a4["the render server<br/>runs it,<br/>every frame"]
  end
  subgraph B["SwiftUI on the Mac"]
    direction TB
    b1["you call<br/>withAnimation"] --> b2["SwiftUI works out<br/>the value on the<br/>main thread,<br/>every pass"] --> b3["it writes<br/>the layer"] --> b4["the render server<br/>draws what<br/>it is given"]
  end
  subgraph C["SwiftUI on iPhone and iPad"]
    direction TB
    c1["you call<br/>withAnimation"] --> c2["SwiftUI works out<br/>the value on its<br/>own thread,<br/>every frame"] --> c3["the value goes<br/>into shared<br/>memory"] --> c4["a small commit<br/>says the memory<br/>changed"] --> c5["the render server<br/>draws what<br/>it is given"]
  end
  A ~~~ B
  B ~~~ C
How I measured
I built a small probe. A SwiftUI view, a stack of two colours, hosted in a window on screen. One property driven by a switch inside withAnimation: opacity, offset, width, scale or rotation. Four kinds of animation: linear, ease in and out, a spring, and a custom animation, which is a callback that returns a value. That is 20 cases. The same properties moved with the framework’s own call, UIView.animate on iPhone and iPad and NSAnimationContext on the Mac, as the baseline.
While the motion ran I recorded three things: every call to the layer’s setters and whether it came on the main thread, every call to addAnimation:forKey:, and the model value and the presentation value of every layer, sampled every 4 milliseconds.
If the app writes the model value on many passes and adds no animation, the app is running the motion. If an animation is added and the model value is written once, the render server is. If the model value is written once, no animation is added through the public call, and the presentation value moves anyway, something I cannot see is making the motion.
I ran it on a Mac (macOS 27.0.1), on an iPhone and an iPad simulator (27.0, 60 Hz), and on a real iPhone 17 Pro Max and a real iPad Pro (27.2, 120 Hz).
What the layer received
| Platform | Verdict, 20 cases | Different model values per case | Values set on presentation modifiers per case |
|---|---|---|---|
| Mac, macOS 27.0.1 | 20 appWrites | 26 to 46 | none |
| iPhone simulator, iOS 27.0 | 20 presentationModifier | 2 to 3 | 40 to 172 |
| iPad simulator, iPadOS 27.0 | 20 presentationModifier | 2 to 3 | 42 to 167 |
| iPhone 17 Pro Max, iOS 27.2 | 20 presentationModifier | 2 to 3 | 42 to 171 |
| iPad Pro M4, iPadOS 27.2 | 20 presentationModifier | 2 to 3 | 90 to 341 |
The table is the whole result of the 20 cases, per platform. On the Mac, SwiftUI wrote the layer’s model value on 26 to 46 different values in half a second, with between 54 and 184 setter calls for a case, every one of them on the main thread, and added no animation, ever. It did not matter whether the animation was linear, ease, spring or custom, or whether the property was opacity, offset, width, scale or rotation.
On iPhone and iPad the model value was written two or three times: the start and the end. No animation was added through addAnimation:forKey:. And the presentation value, what is actually drawn, took 22 to 80 different values as it moved. The motion is real, the app does not write it on every pass, and it is not a public animation object either.
The control is the framework’s own animation. On the Mac, the six cases AppKit could express each added exactly one animation, with the model written once and the presentation taking 32 to 33 values. On iPhone and iPad, 15 UIKit cases did the same, with 26 to 106 presentation values. The probe can see a handed-off animation when there is one.
Block the main thread
The question that matters for an app is simple. If the main thread is busy, does the animation keep moving?
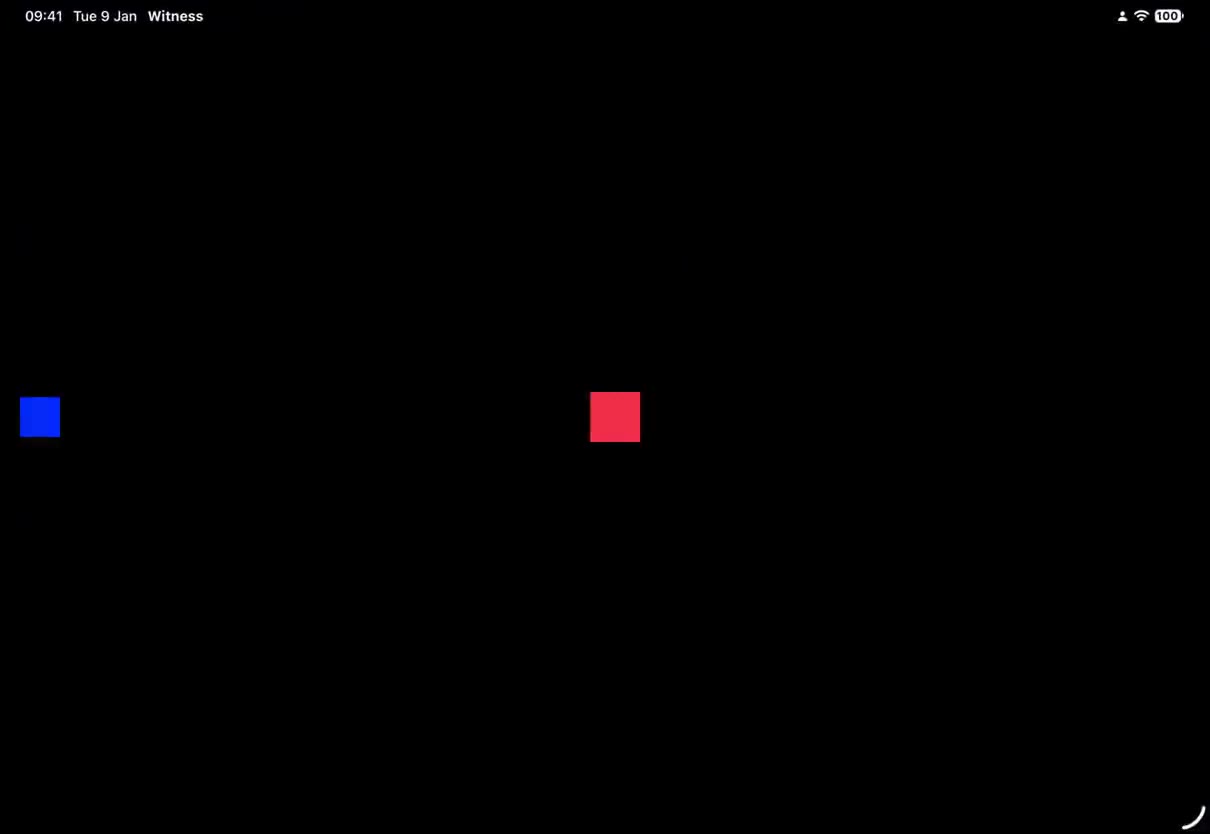
I put a blue square on screen and blocked the main thread for half a second in the middle of the motion. While the square is lit, the thread is blocked. I recorded the screen and read every frame for where the red dot was. On the Mac and in the simulator I read the composited display with a private call. That call returns a blank surface on a real device, so for the devices I did what QuickTime does: plug the device in by USB, switch on one CoreMediaIO setting, and each device shows up as a capture device. The recording is 60 frames a second on both devices, also on the 120 Hz iPad. The Mac capture ran at about 16 frames a second, which is why its chart has fewer, larger steps.
In every chart below, the horizontal axis is seconds from the moment the blue marker lit, sampled every 0.15 seconds, and a * after a time means the main thread was blocked then. The vertical axis is where the dot was, as a fraction of its travel. For each time the chart shows the last frame the screen had drawn by then, which is what you would have seen.
The Mac
Blue is AppKit, green is SwiftUI. The AppKit dot keeps climbing through the block. The SwiftUI dot is flat for the whole stretch, then jumps to where it should have been. In the block shown, it stayed in one place for 523 milliseconds. Over the two blocks the probe judged, the longest wait was 586 milliseconds, and in the frames of the block that were not at its edges the SwiftUI dot was in a new place in none.
The iPhone simulator
A real iPad Pro
A real iPhone 17 Pro Max
On the simulator and on both real devices the two lines lie on top of each other. The SwiftUI dot kept moving through the block, at the same speed as the UIKit dot: 817 pixels a second against 816 on the iPad, 262 against 262 on the iPhone. The longest wait for a new place was one or two captured frames.
All of it in one chart
The last group, the iPad control, is a test I will come back to below. First, the same recordings as moving pictures.
The same recordings, replayed
Each of these videos replays one recording at half speed. The dot is put where the camera saw it, frame by frame, nothing smoothed. The top row is the framework’s own animation, the bottom row is SwiftUI. The blue square is lit while the main thread is blocked. The red bar under a row grows while that dot stays where it is, and a full bar is 0.6 seconds.
The Mac. Watch the red bar under the SwiftUI row.
The real iPad Pro. Nothing to see: no bar grows under either row.
The real iPhone 17 Pro Max.
The real screens
This is a frame from the recording of the iPad, with the blue square lit and the SwiftUI dot still moving.
And the full recordings, trimmed to the run. The iPad, SwiftUI with the main thread blocked:
The iPad, UIKit, the same block:
The iPhone, SwiftUI, cropped to the band the dot travels in:
The iPhone, UIKit:
So with the main thread blocked, SwiftUI on iPhone and iPad keeps animating. SwiftUI on the Mac does not. Something other than the main thread is doing the work on the phones. To find out what, I had to go lower than Objective-C.
Below Objective-C: what SwiftUI does on iPhone and iPad
I listed every method with “animation” in its name on the layer and animation classes, public and private, hooked the ones I could, and recorded the thread and call stack of each call. None of the animation methods was called. But the custom animation showed where the clock runs. On the Mac its callback runs on the main thread, every call. On iPhone and iPad the calls are on a thread named com.apple.SwiftUI.AsyncRenderer, reached from a display link of SwiftUI’s own. During the half second of blocked main thread, the callbacks went on: 24 inside the block on the simulators, 34 on the real iPhone and 48 on the real iPad, none of them on the main thread. On the Mac there were none.
Sampling the process while it animated showed the structure. On iPhone and iPad SwiftUI runs its own display link on that thread. Each tick it updates the graph, renders the display list asynchronously, and writes the values into what its symbols call an async layer. None of this exists on the Mac.
To see how those values reach the screen I attached a debugger to the simulator. SwiftUI’s AsyncLayer.setValue does not touch a layer: it queues the value. A function called commitAsyncValues takes the queued values, and it contains two groups of Core Animation calls. One builds CABasicAnimation objects and adds them. The other uses a class I had not heard of, CAPresentationModifier. I put breakpoints on both while an opacity animated. addAnimation was never called. addPresentationModifier: was called 44 times and -[CAPresentationModifier setValue:] 302 times, all on the AsyncRenderer thread, with the values rising frame by frame.
A presentation modifier is a private Core Animation class, not in the public headers. A layer that has one for a key path shows that value in its presentation without a change to the model value and without an animation. That is exactly what I had measured and could not explain: model written twice, no animation, presentation moving.
Because the class is Objective-C I could hook it on the real devices too. Every one of the 20 SwiftUI cases adds two to four presentation modifiers and sets 42 to 341 values on them, each of those calls off the main thread. The key path follows the property: opacity, bounds, position, or position and transform for scale and rotation. UIKit adds none. The Mac adds none.
Going one level further down, into QuartzCore’s C++, shows what a modifier is for. Each modifier belongs to a group, and a group owns a block of shared memory. On SwiftUI’s thread, every frame, the new value is copied into that shared memory, the group is flushed, and the flush adds a command to Core Animation’s transaction, which the same thread then commits. Here is one frame:
flowchart TB
  tick["the display link ticks"] --> evaluate
  subgraph T["SwiftUI's own thread"]
    direction TB
    evaluate["evaluates the animation<br/>at this time"] --> write["writes the value<br/>into a record"] --> send["sends two small messages,<br/>with no values in them"]
  end
  subgraph R["the render server"]
    direction TB
    swap["swaps the buffer<br/>and reads the value"] --> draw["draws the layer"]
  end
  memory["the shared memory"]
  write --> memory
  send --> swap
  memory --> swap
  note["this half is read from the render server's code,<br/>I did not watch it run"] -.-> swap
The shared memory
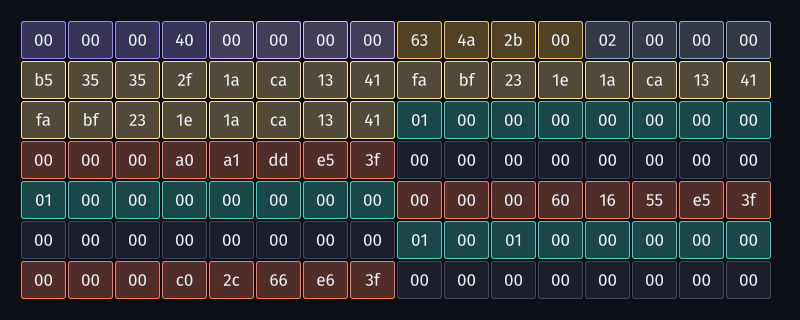
I could reach the group’s shared memory from inside the app, and the disassembly of the render server’s flush function told me where its size and its data pointer sit. So I read it every 4 milliseconds while an opacity animated, on the simulator and on both real devices. It is 114,688 bytes. The first 112 bytes of one reading, from the iPhone 17 Pro Max, are in this picture, coloured by field:
| Bytes | Colour | What it is |
|---|---|---|
| 0 to 3 | violet | A flags word. Bit 0 flips between readings, as the render server’s flush function flips it. |
| 4 to 7 | lilac | The flip flag, equal to that bit. |
| 8 to 11 | amber | A sequence number. It only ever rises. |
| 12 to 15 | grey | A count: 2, the two modifiers. |
| 16 to 39 | pale yellow | Three times, as doubles. |
| 40 to 47 | teal | The flags of record 0: 0x1. |
| 48 to 55 | coral | The value of record 0, a double. It is the animated opacity. |
| 56 to 63 | dark | A second double, 0 in every reading. |
| 64 to 111 | the same | Records 1 and 2 have the same three fields. Record 2 has flags 0x10001. |
The values in the records are the animation. Here are two of the records over the first frames of an opacity animation from 0.2 up to 1 over 0.8 seconds, on the iPhone. The record with flags 0x10001 takes a new value on every frame. The one with flags 0x1 takes a new value on every other frame, and trails by one frame:
And on the iPad Pro at 120 Hz, the same, with twice as many frames in the same time:
So the rate of the values in the memory follows the display’s refresh rate, on every platform. Why a modifier has three records, and what the two flag values mean, I inferred from their rates; I did not read it from code.
The messages
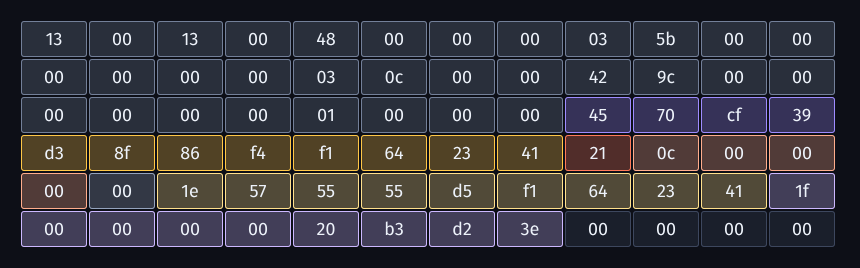
If the values are in shared memory, what does SwiftUI’s thread send the render server on every frame? I put a breakpoint on mach_msg and captured them. Every frame there are two small messages, of 72 and 84 bytes, and every 84 byte message had a 72 byte one within 4 milliseconds. I had guessed the 72 byte one carried a layer’s properties. It does not. Both are the same Core Animation transaction record. Here are the bytes of a real one of each, coloured by field.
The 72 byte message is a transaction with no commands:
| Bytes | Colour | What it is |
|---|---|---|
| 0 to 31 | grey | The Mach message header (24 bytes) and two words. |
| 32 to 35 | violet | The context the message is for. |
| 36 to 43 | amber | A time, a double. |
| 44 | coral | The marker 0x21: a transaction record follows. |
| 45 to 48 | light coral | A commit counter. |
| 49 | grey | A flags byte, 0 in every message. |
| 50 to 58 | pale yellow | The marker 0x1e and a second time. |
| 59 to 67 | lilac | The marker 0x1f and a last double, of a few microseconds. |
| 68 to 71 | dark | Zeros. |
The 84 byte message is the same record with the reference to the shared memory in front of it:
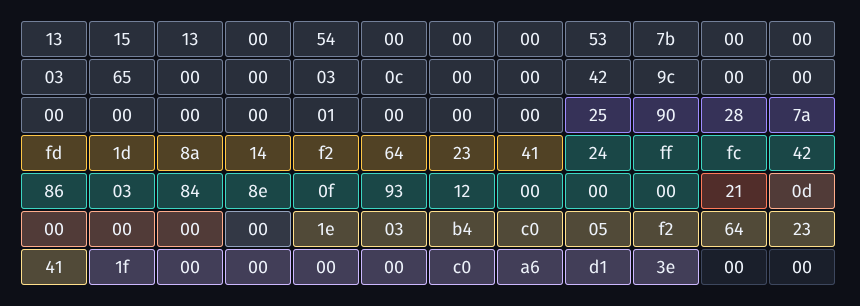
| Bytes | Colour | What it is |
|---|---|---|
| 0 to 43 | grey, violet, amber | The same header, context and time as above. |
| 44 to 57 | teal | The marker 0x24, a 9 byte key, an index byte and three zeros: the reference to the shared memory. |
| 58 | coral | The marker 0x21. |
| 59 to 82 | the same | The commit counter, flags, the two times and the last double, as above, then two bytes of zeros. |
I found which function writes each marker byte by scanning QuartzCore’s code for the instruction that stores it. 0x21, 0x1e and 0x1f are all written in CA::Context::commit_transaction, followed by the call that sends the message. 0x24 is written by CA::Context::commit_command.
Nothing in the per-frame traffic is a property value. The values are in the shared memory, and the messages only say that it was updated. That the render server then swaps the buffer and reads the values each frame I know from reading its code. I could not watch it: a debugger is refused on the render server even in the simulator.
The control: who runs it
Two more tests ask what the render server does by itself. The first one stops SwiftUI’s own render thread for half a second instead of blocking the main thread. If the render server ran a SwiftUI animation on its own, the dot would not care. Here is the screen, in the same chart as before, on the real iPad:
The UIKit dot ignores the stop. The SwiftUI dot stays in one place for 500 milliseconds, then jumps. The replay shows it, with the red bar:
And the real recordings, on the iPad and the iPhone:
The second test is the render server’s own frame counter, which I read from another thread through a private C function. Blocking the main thread changes nothing for either framework:
Stopping SwiftUI’s thread takes the render server’s frames away, for SwiftUI only:
On the simulator the server went from 59.9 frames a second to none while SwiftUI’s thread was stopped, and on the iPad Pro from 120.4 to 5.4. The UIKit animation was untouched in both. So the render server does not animate a SwiftUI animation by itself. It draws what SwiftUI’s thread sends it, and when that thread stops it has nothing to draw. The iPhone 17 Pro Max’s counter drew 60 frames a second in every run, so it is not an instrument there, and I left it out.
So which is it
Both are true, on different platforms.
| Mac | iPhone and iPad | |
|---|---|---|
UIView.animate, animator() | data, the render server runs it | data, the render server runs it |
| SwiftUI built-in animation | the app writes every pass, on the main thread | presentation modifiers set from SwiftUI’s own thread, model written twice, no animation |
| SwiftUI custom animation callback | on the main thread | off the main thread |
| Main thread blocked | the SwiftUI animation stops, the dot waits | it keeps going at the same speed as UIKit |
| SwiftUI’s own thread stopped | not applicable | the SwiftUI animation stops, the UIKit one does not |
The popular description of SwiftUI as a pull model driven from the main thread is a description of the Mac. And Apple’s sentence from WWDC 2023, that built-in attributes run off the main thread, fits iPhone and iPad and does not fit the Mac.
What it means for your code
Three things I would act on, and one I would not.
On the Mac, SwiftUI animations share the main thread with everything else. A slow
body, a long layout, a synchronous call, and the animation stutters, where a Core Animation animation would have kept moving. For motion that must not stutter on the Mac, the framework’s own animation is the safer choice.A custom animation’s
animateis not on the main thread on iPhone and iPad. If it touches main-actor state, that is a data race waiting to happen. I measured it with a callback that only counts, so I know where it runs, not what breaks.Do not generalize from one platform. Whatever you read about how SwiftUI animates, check which platform it was measured on. I nearly did not.
And the one I would not: do not build on the private classes in this post. I used them to look, nothing else.
What I got wrong on the way
This is the part worth reading twice, because the mistakes are easy.
My first iOS runs read model values only and showed almost nothing happening. The motion only appeared when I read presentation values too.
Then I counted 54 setter calls for an opacity animation on the iPhone where the app made 4. Reading layer.presentation() builds a copy of the layer, and building the copy calls the setters I was hooking. I was counting my own probe. The hooks now stand down while the probe reads.
I first tested the blocked main thread by reading presentation values from a background thread. It said UIKit’s own animation had stalled too, which I knew was false. A measurement that fails on the case whose answer you know does not measure what you wanted, so I dropped it and counted callbacks and then screens instead.
I moved a threshold after seeing the data, from 20 different values to 10, because two iPhone cases fell at 19 and 20 on a 120 Hz screen. It changes those two verdicts only.
My first colour thresholds for finding the red dot sat on the edge of the iPhone’s red and found it in only some frames, which showed as impossible speeds. I widened them and recorded all eight runs again.
And I guessed that the 72 byte message carried a layer’s properties. Decoding it showed it does not.
What I do not know
Where the last number in each frame’s record comes from (a few microseconds), what the command is called, and why each modifier has three records in the shared memory.
Stalls shorter than about 35 milliseconds on a real device: the recording I could take is 60 frames a second, also on the 120 Hz iPad.
scaleEffectandrotationEffectwith the main thread blocked, on both platforms. The blocked test only covers the custom animation.How many messages SwiftUI sends per frame on the Mac. I counted them on the iPhone simulator, not on the Mac.
Transitions, matched geometry, keyframe and phase animators,
CanvasandTimelineView. I probed five properties and four kinds of animation, in a hosted view with a fixed layout.Whether the Mac differs on a newer build than 27.0.1.
The probe, the recordings and the decoded bytes are in a private repository for now. Every number in this post is in the charts and tables above, taken from those recordings.